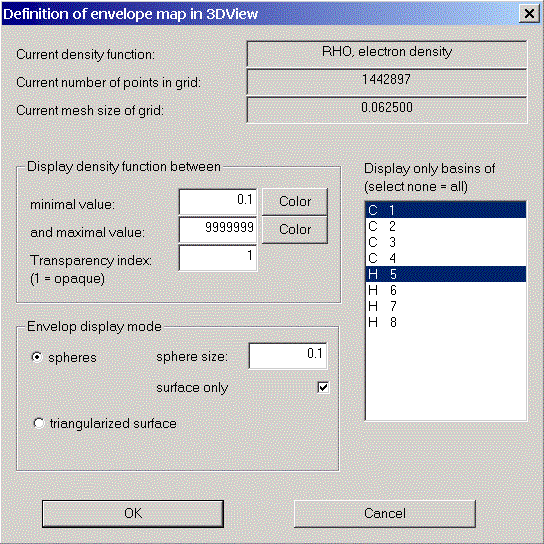
Use this dialog to define the kind of envelope map you want to display in 3D-View.
All envelope maps are based on the envelope grid calculated before. The statistics of the envelope grid together with the current density function are displayed in the first three lines of the dialog.
The rest of the dialog enables you to manipulate the appearance of the envelope map and to restrict the points displayed to the region you are interested in.
First, on the left hand side, you specify an intervall of values of the current density you want to see in the map. By clicking on the Color buttons you can assign a color to each intervall border. There will be a smooth, linear transition between these colors.
Additionally, you can assign a transparency index (alpha-value) to the envelope map. A positive value less than one results in a more or less transparent map. For your first tests leave this value at 1. Transparency is a tricky business and only works with dark backgrounds.
After you defined a density function intervall you can restrict your envelope map to certain atoms in the molecule. On the right hand side you find a list of all atoms in your molecule. Select the ones you want to see in your map.
Finally you can manipulate the appearance of your map:
You can change the diameter of the spheres which are displayed around each point in your map.
You can switch to a solid representation by deselecting "surface only":
all points in your density function intervall will be displayed, not just those on the surface of the envelope.
You can switch from a spherical representation to a triangularized one by selecting "triangularized surface".
You will get a more or less smooth surface consisting of triangles instead of spheres.
OK finishes the dialog and constructs the envelope map. Don't forget to enable envelope maps in the context menu of 3D-View.
Cancel leaves the dialog without changing the current envelope map.