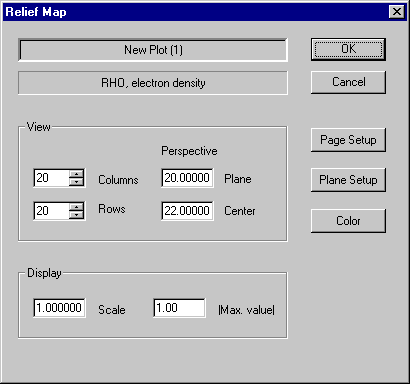
| OK: |
Press this button to close the dialog and use current
parameters for plot creation. |
| Cancel: |
Press this button to close the form and to reject changes. |
| Page Setup: |
Press this button to open the page setup form, where the global
layout of the plot is defined (orientation, page size,...). |
| Plane Setup: |
Press this button to open the plane setup form |
| Perspective: |
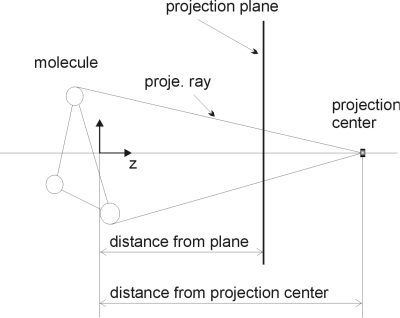
A center projection is used for the perspective. The principle
is shown in fig. 1. Each point of the molecule will be projected onto the
projection plane by rays coming from the point and going to the center of the
projection. There are two ways to get a parallel projection: 1. Move the center
far away from the plane. 2. Set "Plane" and "Center" to the
same value. Remark: Moving the plane and/or the center into the molecule will
result in strange looking plots. |
| |
 |
| Columns and Rows: |
The selected plane will be divided into rows and columns (can be
seen if element borders are switched on. See Color). The density
function will be evaluated and displayed at each intersection point. |
| Scale: |
All values of the density function are multiplied with this number
|
| |Max. value|: |
Maximum value of the density function displayed. Greater values
are cut off. |


