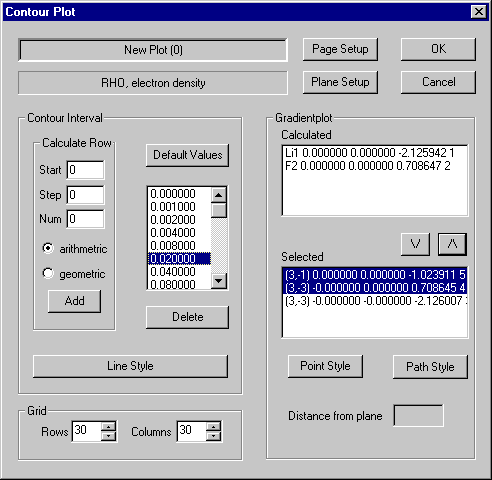
OK: Press this button to close the dialog and create a plot with the current parameters.
Cancel: Press this button to close the form and to reject any changes except style parameters.
Page Setup: Press this button to open the page setup form, where the global layout of the plot is defined (orientation, page size,...).
Plane Setup: Press this button to open the plane setup form.
Define Contour values:
Single Value: Type the value into the "start" field, set "Step" and "Num" to 0 and press "Add".
Arithmetic Row: Set the values for "Start", "Step" and "Num" and press "Add" Value ai = ai-1 + "Step", i = 1 ... "Num" -1.
Geometric Row: Set the values for "Start", "Step" and "Num" and press "Add" Value ai = ai-1 * "Step", i = 1 ... "Num" -1
Delete Contour values: First select values from the list and then press "Delete".
Line Style: Line size, style and color can be selected.
Grid: The plane is divided into cells by columns and rows. Each cell is again divided into four triangles. The algorithm uses this discretization to calculate the plot. Higher values of row and column will result in a finer plot and will need more time for the calculation.
Calculated Points: This list shows all atoms and calculated critical points. Select points and press "down arrow". The selected points will move to the list at the bottom.
Selected Points: This list represents the points which will be shown in the plot and/or are sources for gradient paths. First select points from the list, then change its properties by pressing Point Style or Path Style
Distance from Plane: Shows the points distance from the selected plane.